Probability & statistics
Probability, distributions, samples, tests, correlation and the most common statistical mistakes.
Bayes' theorem and false positives: the diagnostic test case
Bayes' theorem applied to a test with 99% sensitivity: why a positive result can be wrong in 5 cases out of 6 and how to update the estimate step by step.
The binomial distribution: counting successes in n trials
When to use the binomial, how to compute P(X = k) with the binomial coefficient, mean and variance, and a full quality control example worked in Python.
The birthday paradox and collisions in identifiers
Just 23 people give over a 50% chance of a shared birthday. The calculation, the approximate formula and what it teaches about hashes and random IDs.
The central limit theorem explained with a simulation
Why sample means tend towards a normal even with skewed data, what the standard error is, when 30 cases are not enough and a hands-on test in Python.
The chi-square test: goodness of fit and independence
How the chi-square test checks a die or compares error rates between groups, with step-by-step calculations, degrees of freedom and conditions of use.
Conditional probability and independence explained with examples
How to compute conditional probability, what independence between events really means and why confusing P(A|B) with P(B|A) leads to serious mistakes.
Confidence intervals: how to compute them and what they mean
Confidence intervals for means and proportions with worked numbers, the correct reading of 95%, the bootstrap method and common interpretation errors.
Correlation is not causation: confounders, reversals, selection
The five alternative explanations of a correlation, from confounders to reverse causation to selection bias, and methods that get closer to proof.
Hypothesis tests and p-values: what they say and what they don't
Null hypothesis, significance level and p-value explained with a suspicious coin, plus the misinterpretations to avoid and the role of effect size.
The law of large numbers and the gambler's fallacy
What the law of large numbers really guarantees, why chance does not «make up» for losing streaks and how small samples produce extreme results more often.
Mean, median and mode: which measure to use and when
Arithmetic mean, median, mode, trimmed, geometric and harmonic mean: how to compute them, how they react to extremes and which to choose case by case.
Measures of spread: standard deviation, IQR and outliers
Range, variance, standard deviation with n − 1, interquartile range, MAD and coefficient of variation: how to measure variability and spot outliers.
Monte Carlo simulation in Python: estimating with chance
How to use Monte Carlo simulation to estimate π and a project's duration with NumPy, how precise the estimate is and which typical mistakes to avoid.
The Monty Hall problem: why you should switch doors
The Monty Hall problem explained with three arguments and a Python simulation: switching wins 2 times out of 3, and here is where the error comes from.
Multiple comparisons and p-hacking: too many tests, false results
Why with 20 tests a false positive has a 64% chance, how the Bonferroni, Holm and Benjamini-Hochberg corrections work and how to avoid p-hacking.
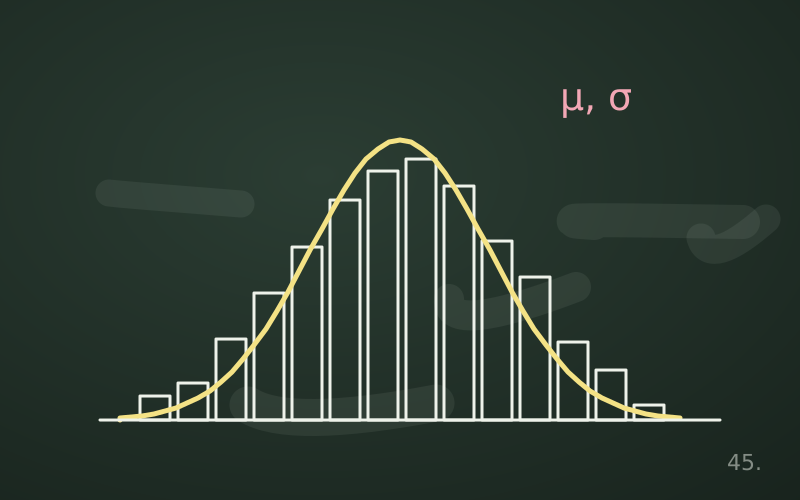
The normal distribution and the 68-95-99.7 rule
The bell curve explained in practice: z-scores, the 68-95-99.7 rule, computing tails with Python and the real cases where assuming normality is a mistake.
Pearson and Spearman correlation: reading it without errors
What the correlation coefficient measures, Pearson versus Spearman, Anscombe's quartet and the traps of outliers and nonlinear relationships.
The Poisson distribution: counting events over time
When to use the Poisson distribution for tickets, errors and requests, how to compute probabilities, set alert thresholds and recognise overdispersion.
What probability is: three interpretations and the axioms
Classical, frequentist and subjective probability compared, plus Kolmogorov's axioms and the rules that follow from them, explained with dice and cards.
Random variables, expected value and variance made clear
What a random variable is, how to compute expected value and variance, linearity of expectation and why the mean alone is never enough to assess a risk.
Regression to the mean: why extremes do not repeat
Why an extreme result tends to be followed by a more ordinary one, how this misleads evaluations of interventions and how a control group protects you.
Sampling: methods, sample size and biases
Simple random, systematic, stratified and cluster sampling, how large a sample should be and how to recognise selection, non-response and coverage bias.
Simple linear regression: least squares and residuals
How to compute a regression line with least squares, what slope, intercept and R² mean, how to read the residuals and why extrapolating is risky.
Simpson's paradox: when aggregated data reverse
A group that is better in every subgroup can be worse overall: Simpson's paradox with a numerical example, its causes and which figure to trust.
Type I and type II errors and statistical power
False positives and false negatives in tests, what α, β and power are, and how to compute an A/B test's sample size in advance with a worked example.