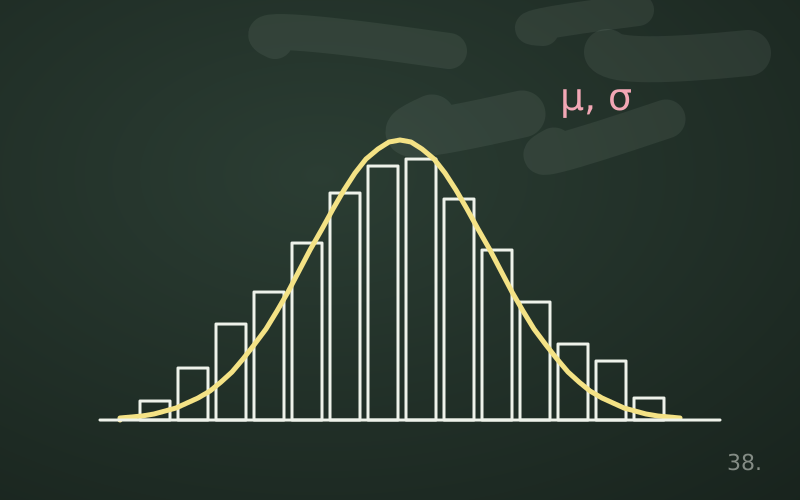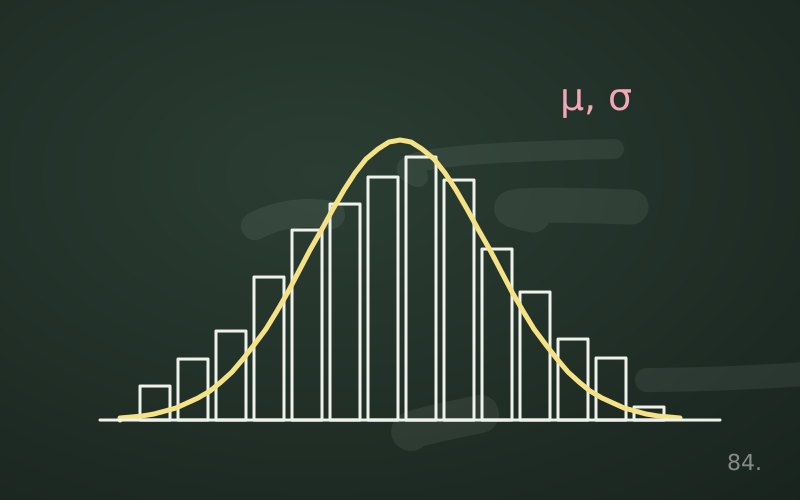
You do not need to drink the whole pot to know whether the soup is salty: a spoonful is enough, provided the soup has been stirred well. This image sums up sampling: you observe a small part to learn about the whole. It works surprisingly well, under one decisive condition: the way the sample is chosen matters much more than its size.
Population, sample and parameter
- The population is the complete set of what we want to study: all customers, all parts produced in a month, all requests received by a server.
- The sample is the part we actually observe.
- The parameter is the true value in the population, for example the share of satisfied customers; the estimate is the value we compute on the sample.
The goal is for the estimate to be close to the parameter, and to be able to quantify how far from it it might be.
The main probability methods
Simple random sampling
Every element of the population has the same probability of being chosen, and every subset of the same size has the same probability of being the sample. It requires a complete list of the population, the so-called sampling frame, and a truly random selection mechanism, such as a random number generator.
Systematic sampling
You choose a random starting point and then one element every k: for example one order every 50 starting from the seventeenth. It is practical, but becomes dangerous if the data contain a periodicity that coincides with k: sampling logs every 24 hours at the same time always captures the same moment of the day.
Stratified sampling
The population is divided into homogeneous groups, the strata, and a random sample is drawn from each. If customers are 70% private individuals and 30% businesses, you can ensure the sample respects these proportions. It reduces error when the strata differ from each other and makes it possible to have enough observations even in small groups.
Cluster sampling
Whole groups are drawn at random, such as schools, offices or production batches, and all the elements within them are observed. It is cheap when the population is scattered, but less precise for the same size, because elements of the same cluster tend to resemble each other.
How large should the sample be
To estimate a proportion, the 95% margin of error is about 1.96 · √(p(1 − p)/n). In the least favourable case, p = 0.5, this gives the practical rule of about 1/√n:
| Sample size | Approximate margin of error |
|---|---|
| 100 | about ±10 percentage points |
| 400 | about ±5 points |
| 1,000 | about ±3 points |
| 2,500 | about ±2 points |
An often counter-intuitive fact is that, if the population is much larger than the sample, its size hardly matters at all: a random sample of 1,000 people has roughly the same precision for a city of a hundred thousand inhabitants or for a country of sixty million. What counts is the size of the sample, not the fraction of the population observed.
The margin of error, however, measures only random error. It says nothing about systematic biases, which are the real danger.
The most common biases
Selection bias
The sample is chosen in a way that favours some elements. The best-known historical example is the Literary Digest magazine poll for the 1936 American presidential election: millions of responses collected from lists of subscribers, car owners and telephone owners, at the time wealthier than average, predicted a victory for Alf Landon. Franklin D. Roosevelt won instead by a wide margin. A huge but biased sample had failed.
Self-selection
Only those who want to respond do so. Online reviews and website polls attract mostly the very satisfied and the very angry. The average of the opinions collected does not represent that of the customers.
Non-response
Even starting from a random sample, if some people refuse to take part and those who refuse differ from those who respond, the estimate shifts. The response rate should always be reported.
Coverage error
The sampling frame does not coincide with the population. An email survey excludes those without an email address; an analysis of logged requests only excludes those blocked before reaching the logs.
Survivorship bias
Only the elements that passed a filter are observed. Studying only companies still in business to understand what leads to success ignores all those that made the same choices and closed. Analysing only disks that still work makes the models look more reliable than they are.
A checklist
- Define the population of interest precisely.
- Check that the sampling frame really covers it.
- Use a random selection mechanism, not convenience.
- Record who did not respond or was excluded, and why.
- Remember that a large biased sample is worse than a small random one, because it gives false confidence.
In short
- The method of choosing the sample matters more than its size.
- Simple random, systematic, stratified and cluster sampling have different advantages and risks.
- The margin of error for a proportion is about 1/√n and does not depend on the population size.
- The margin of error ignores systematic biases.
- Selection, self-selection, non-response, coverage and survivorship are the biases to look for every time.