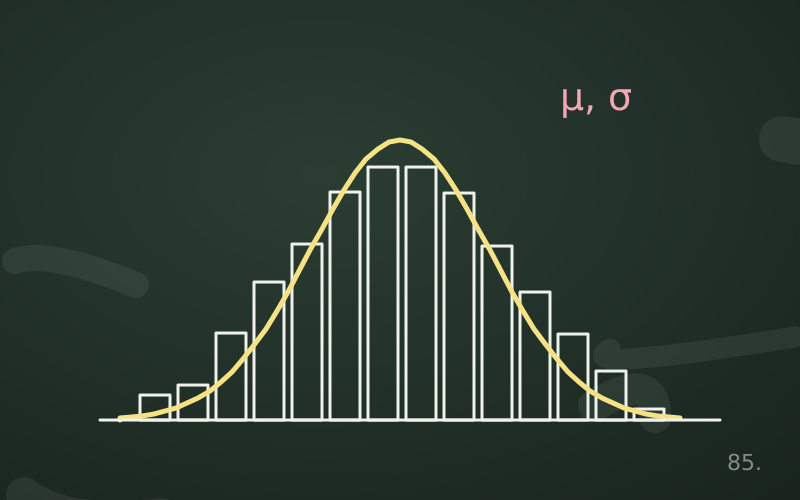
Events answer yes-or-no questions: «did a six come up?», «did the server respond?». Many questions, however, ask for a number: how many errors in an hour, how many seconds of latency, how many euros won or lost. To handle them we need a random variable, and the two numbers that most often summarise it: expected value and variance.
What a random variable is
Despite its name, a random variable is neither a variable nor «random» in a vague sense: it is a function that assigns a number to each outcome of an experiment. If we roll two dice, the sum of the points is a random variable taking values from 2 to 12. The number of requests reaching a server in a minute is another.
There are two types:
- discrete, taking isolated values, usually integers (number of defects, clicks, heads);
- continuous, which can take any value in an interval (times, temperatures, weights).
A discrete variable is described by its probability distribution: the list of possible values with the probability of each.
Expected value
The expected value, written E[X], is the average of the possible values weighted by their probabilities:
E[X] = Σ x · P(X = x)
For a fair die: E[X] = (1 + 2 + 3 + 4 + 5 + 6) / 6 = 3.5.
The expected value is not necessarily a possible value: no die shows 3.5. It is the centre of gravity of the distribution, and the value around which the average of many repetitions settles.
A game to evaluate
You pay 1 euro to roll a die; if a 6 comes up you receive 5 euros, otherwise nothing. The net gain is +4 with probability 1/6 and −1 with probability 5/6:
E[gain] = 4 · (1/6) + (−1) · (5/6) = −1/6 ≈ −0.17 euros
On average you lose about 17 cents per game. A single game may go well, but over a thousand games the expected loss is about 167 euros.
Linearity of expectation
A very powerful property is that the expected value of a sum is the sum of the expected values:
E[X + Y] = E[X] + E[Y] and E[aX + b] = a · E[X] + b
It holds always, even if X and Y are dependent. The sum of two dice has expectation 3.5 + 3.5 = 7, without listing the 36 combinations.
This property solves problems that look hard. If ten people leave their hats at the entrance and pick them up at random, how many on average get their own back? Each person has a 1/10 probability of taking their own hat, so the expectation is 10 · 1/10 = 1. And the result does not change with a hundred or a thousand people.
Variance: how far values stray from the mean
Two variables can have the same expected value and be very different. An investment that always returns 100 euros and one that returns 0 or 200 with equal probability have the same expectation, but not the same risk. Variance measures how much the values spread around the expectation:
Var(X) = E[(X − E[X])²] = E[X²] − (E[X])²
For the die: E[X²] = (1 + 4 + 9 + 16 + 25 + 36) / 6 = 91/6, so Var(X) = 91/6 − 3.5² = 35/12 ≈ 2.92.
Since variance is expressed in squared units, the standard deviation, its square root, is often used instead, as it has the same unit as the variable. For the die it is about 1.71.
Properties of variance
- Var(aX + b) = a² · Var(X): adding a constant does not change the spread, multiplying by a scales it by a².
- If X and Y are independent, Var(X + Y) = Var(X) + Var(Y).
- If they are not independent, a covariance term must be added: Var(X + Y) = Var(X) + Var(Y) + 2 Cov(X, Y).
Unlike expectation, then, the variance of a sum requires attention to dependence.
Why the mean alone is not enough
In technical work the expected value is used everywhere, but on its own it can mislead:
- Latency: an average response time of 200 milliseconds can hide 1% of requests that take several seconds. Those are the ones users remember.
- Cost of a failure: a rare but catastrophic event can have a modest expectation and at the same time be unacceptable, because you do not get the chance to «average out» over many repetitions.
- Projects: estimating the average duration of tasks and adding them up gives the expectation of the total, but says nothing about how likely a large overrun is.
This is why, alongside the expectation, you should always look at a measure of spread and, where possible, the high percentiles of the distribution.
A practical summary
| Quantity | What it tells you | Example with a die |
|---|---|---|
| Expected value | Centre of gravity, long-run average | 3.5 |
| Variance | Spread, in squared units | about 2.92 |
| Standard deviation | Spread, in the same unit | about 1.71 |
In short
- A random variable assigns a number to each outcome of an experiment.
- The expected value is the probability-weighted average and need not be a possible value.
- The expectation of a sum is always the sum of the expectations, even with dependent variables.
- Variance measures spread; for sums of dependent variables covariance is needed.
- Assessing a risk requires at least expectation and spread, better still the percentiles.